Modern web and mobile applications live or die by their speed, stability, and scalability. Users expect sub-second responses, executives demand uptime, and DevOps pipelines crank out new builds faster than ever. In that high-pressure environment, performance testing is no longer optional; it is the safety net that keeps releases from crashing and brands from burning. Apache JMeter, a 100 % open-source tool, has earned its place as a favorite for API, web, database, and micro-service tests because it is lightweight, scriptable, and CI/CD-friendly. This JMeter Tutorial walks you through installing JMeter, creating your first Test Plan, running realistic load scenarios, and producing client-ready HTML reports, all without skipping a single topic from the original draft. Whether you are a QA engineer exploring non-functional testing for the first time or a seasoned SRE looking to tighten your feedback loop, the next 15 minutes will equip you to design, execute, and analyze reliable performance tests.
What is Performance Testing?
To begin with, performance testing is a form of non-functional testing used to determine how a system performs in terms of responsiveness and stability under a particular workload. It is critical to verify the speed, scalability, and reliability of an application. Unlike functional testing, which validates what the software does, performance testing focuses on how the system behaves.
Goals of Performance Testing
The main objectives include:
- Validating response times to ensure user satisfaction.
- Confirming that the system remains stable under expected and peak loads.
- Identifying bottlenecks such as database locks, memory leaks, or CPU spikes, that can degrade performance.
Related Blogs
Types of Performance Testing
Moving forward, it’s important to understand that performance testing is not a one-size-fits-all approach. Various types exist to address specific concerns:
- Load Testing: Measures system behavior under expected user loads.
- Stress Testing: Pushes the system beyond its operational capacity to identify breaking points.
- Spike Testing: Assesses system response to sudden increases in load.
- Endurance Testing: Evaluates system stability over extended periods.
- Scalability Testing: Determines the system’s ability to scale up with increasing load.
- Volume Testing: Tests the system’s capacity to handle large volumes of data.
Each type helps uncover different aspects of system performance and provides insights to make informed improvements.
Popular Tools for Performance Testing
There are several performance testing tools available in the market, each offering unique features. Among them, the following are some of the most widely used:
- Apache JMeter: Open-source, supports multiple protocols, and is highly extensible.
- LoadRunner: A commercial tool offering comprehensive support for various protocols.
- Gatling: A developer-friendly tool using Scala-based DSL.
- k6: A modern load testing tool built for automation and CI/CD pipelines.
- Locust: An event-based Python tool great for scripting custom scenarios.
Why Choose Apache JMeter?
Compared to others, Apache JMeter stands out due to its versatility and community support. It is completely free and supports a wide range of protocols, including HTTP, FTP, JDBC, and more. Moreover, with both GUI and CLI support, JMeter is ideal for designing and automating performance tests. It also integrates seamlessly with CI/CD tools like Jenkins and offers a rich plugin ecosystem for extended functionality.
Installing JMeter
Getting started with Apache JMeter is straightforward:
- First, install Java (JDK 8 or above) on your system.
- Next, download JMeter from the official website: https://jmeter.apache.org.
- Unzip the downloaded archive.
- Finally, run jmeter.bat for Windows or jmeter.sh for Linux/macOS to launch the GUI.
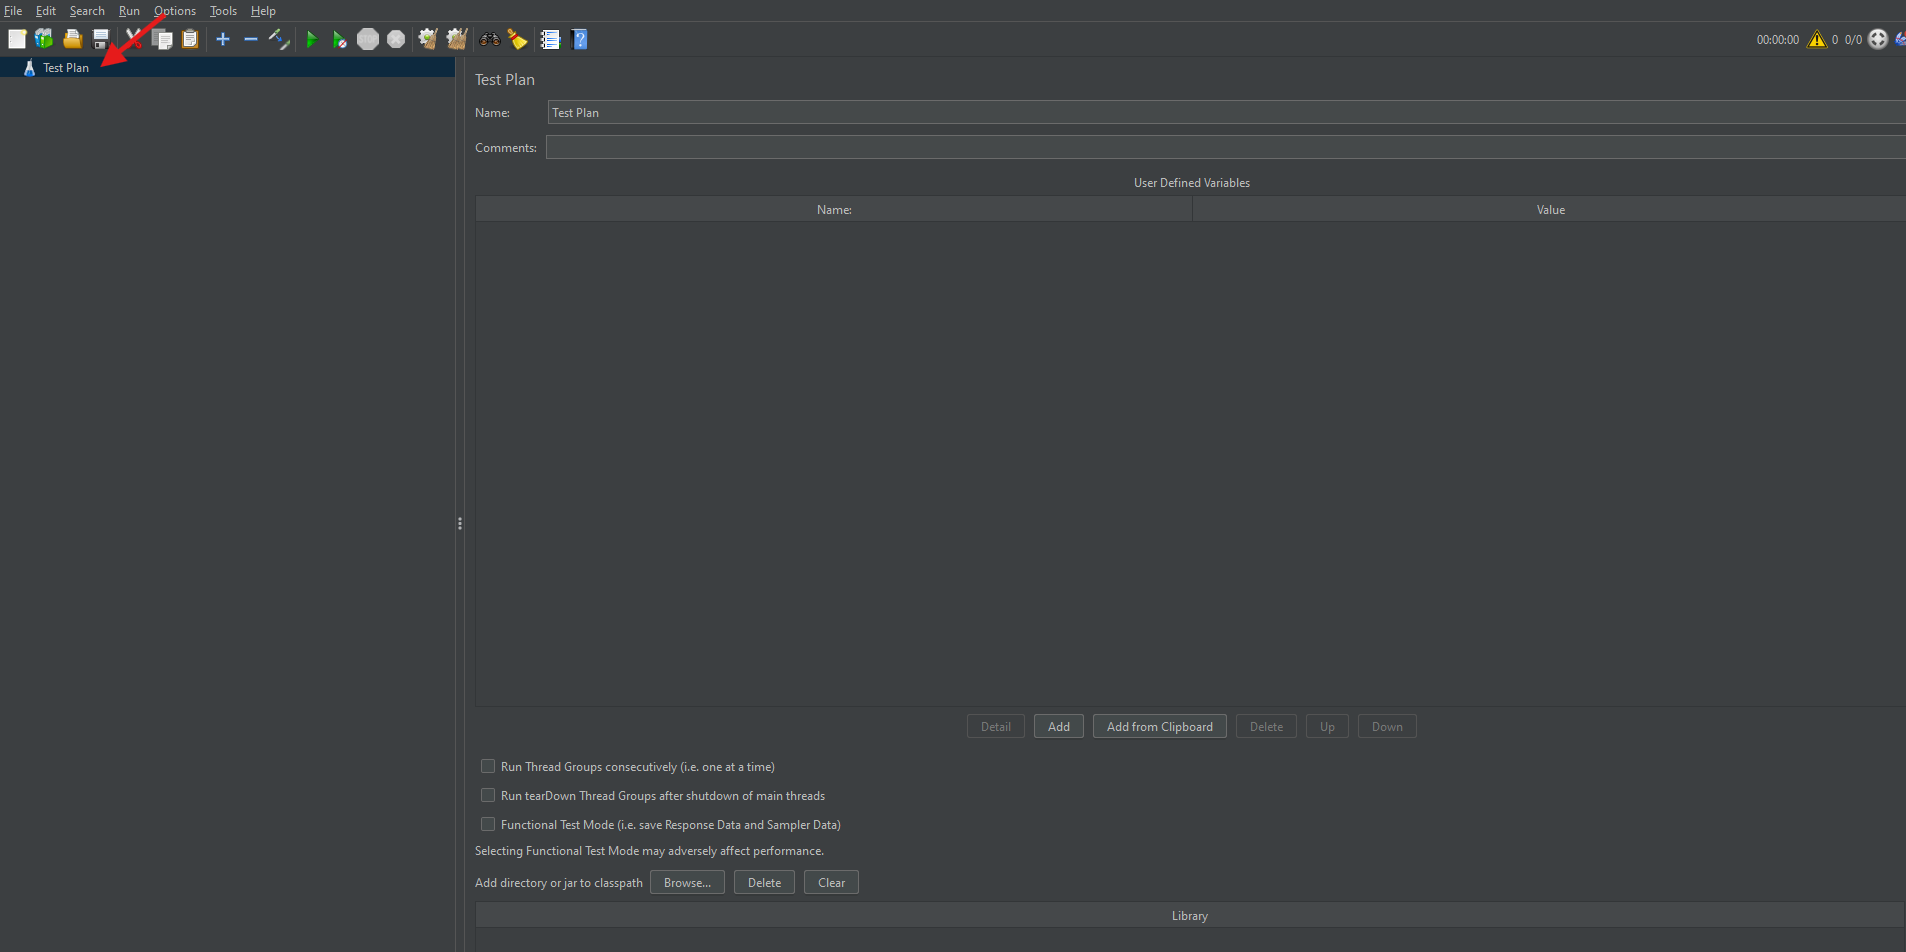
Once launched, you’ll be greeted by the JMeter GUI, where you can start creating your test plans.
What is a Test Plan?
A Test Plan in JMeter is the blueprint of your testing process. Essentially, it defines the sequence of steps to execute your performance test. The Test Plan includes elements such as Thread Groups, Samplers, Listeners, and Config Elements. Therefore, it acts as the container for all test-related settings and components.
Adding a Thread Group in JMeter
Thread Groups are the starting point of any Test Plan. They simulate user requests to the server.
How to Add a Thread Group:
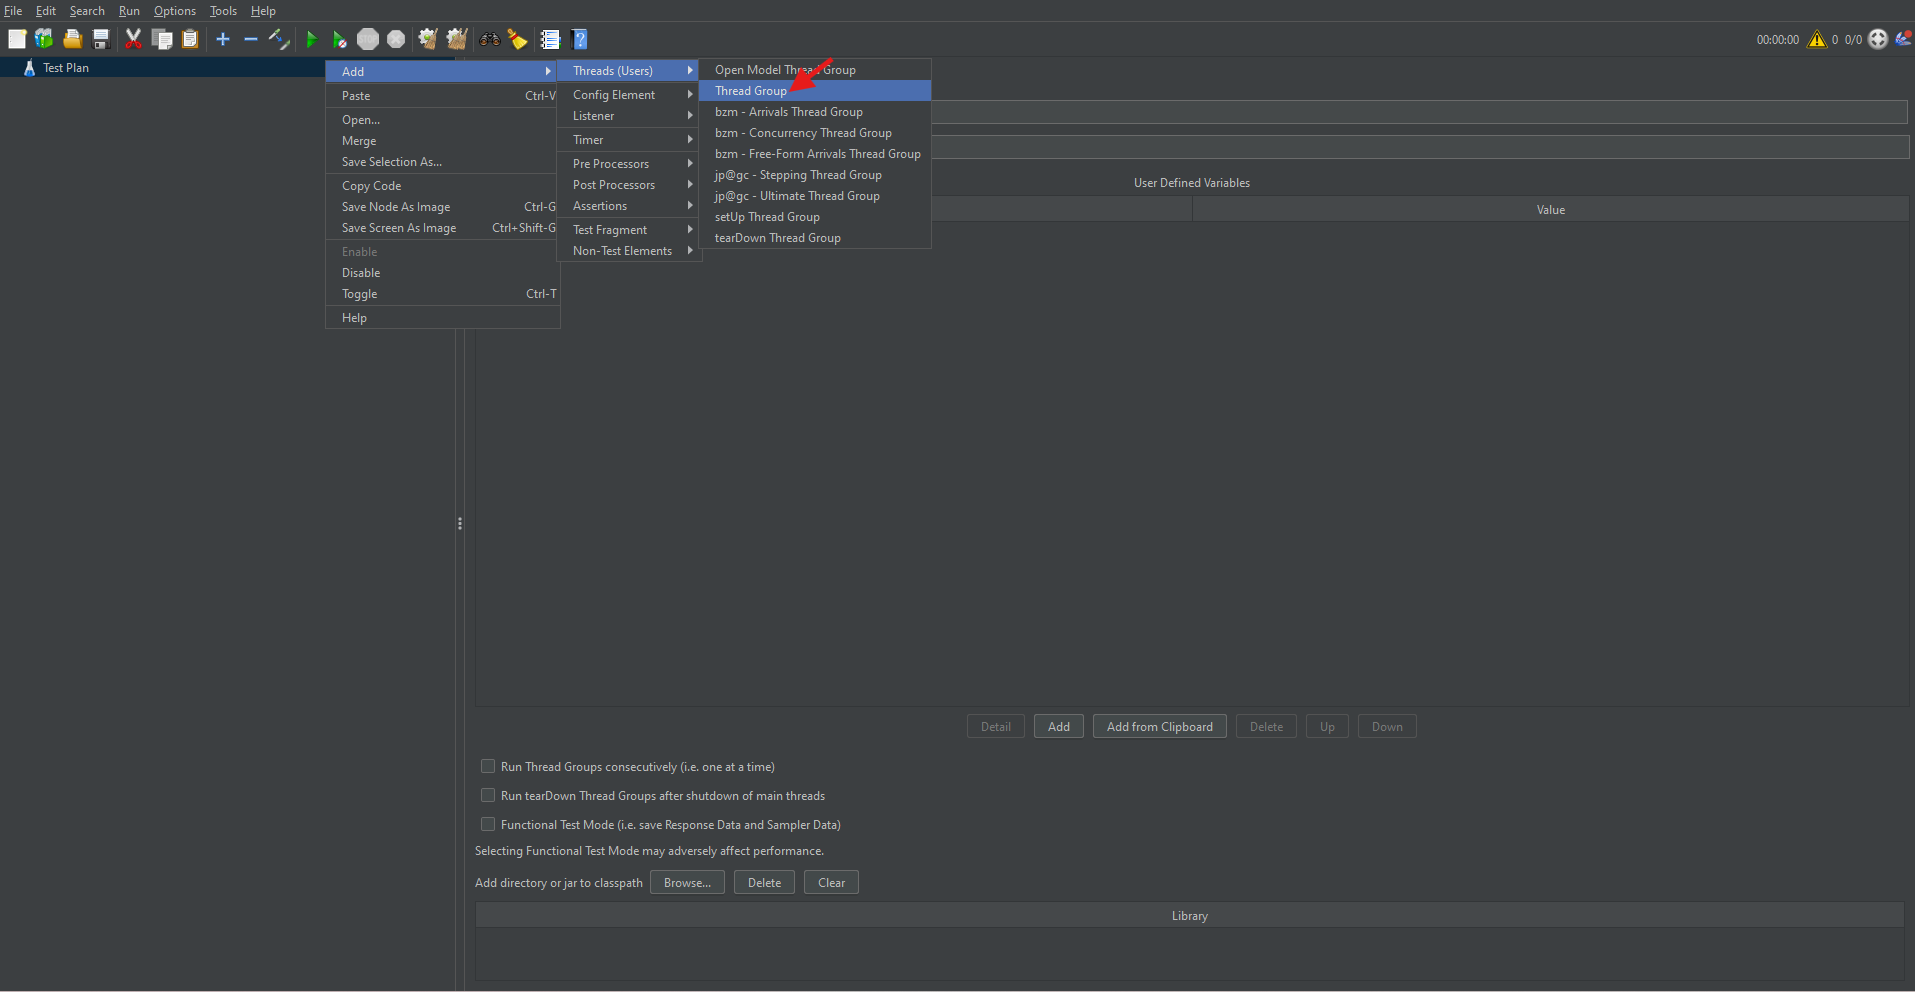
- To begin, right-click on the Test Plan.
- Navigate to Add → Threads (Users) → Thread Group.
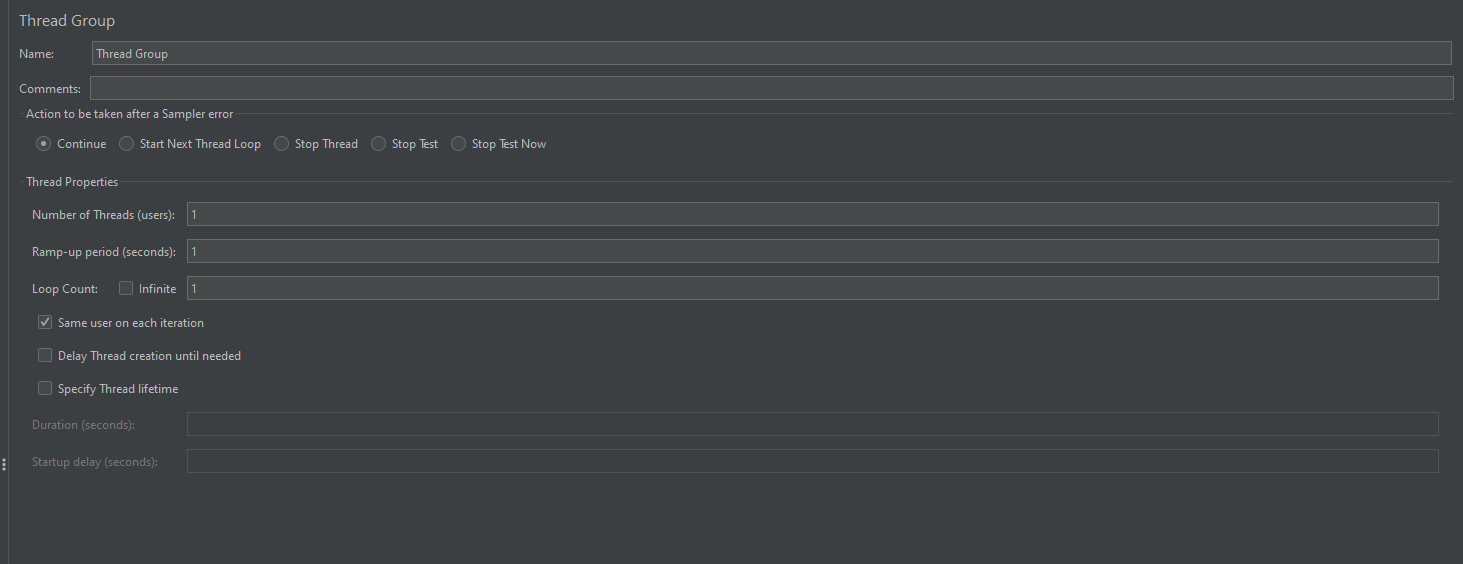
Thread Group Parameters:
- Number of Threads (Users): Represents the number of virtual users.
- Ramp-Up Period (in seconds): Time taken to start all users.
- Loop Count: Number of times the test should be repeated.
Setting appropriate values for these parameters ensures a realistic simulation of user load.
How to Add an HTTP Request Sampler
Once the Thread Group is added, you can simulate web requests using HTTP Request Samplers.
Steps:
- Right-click on the Thread Group.
- Choose Add → Sampler → HTTP Request.
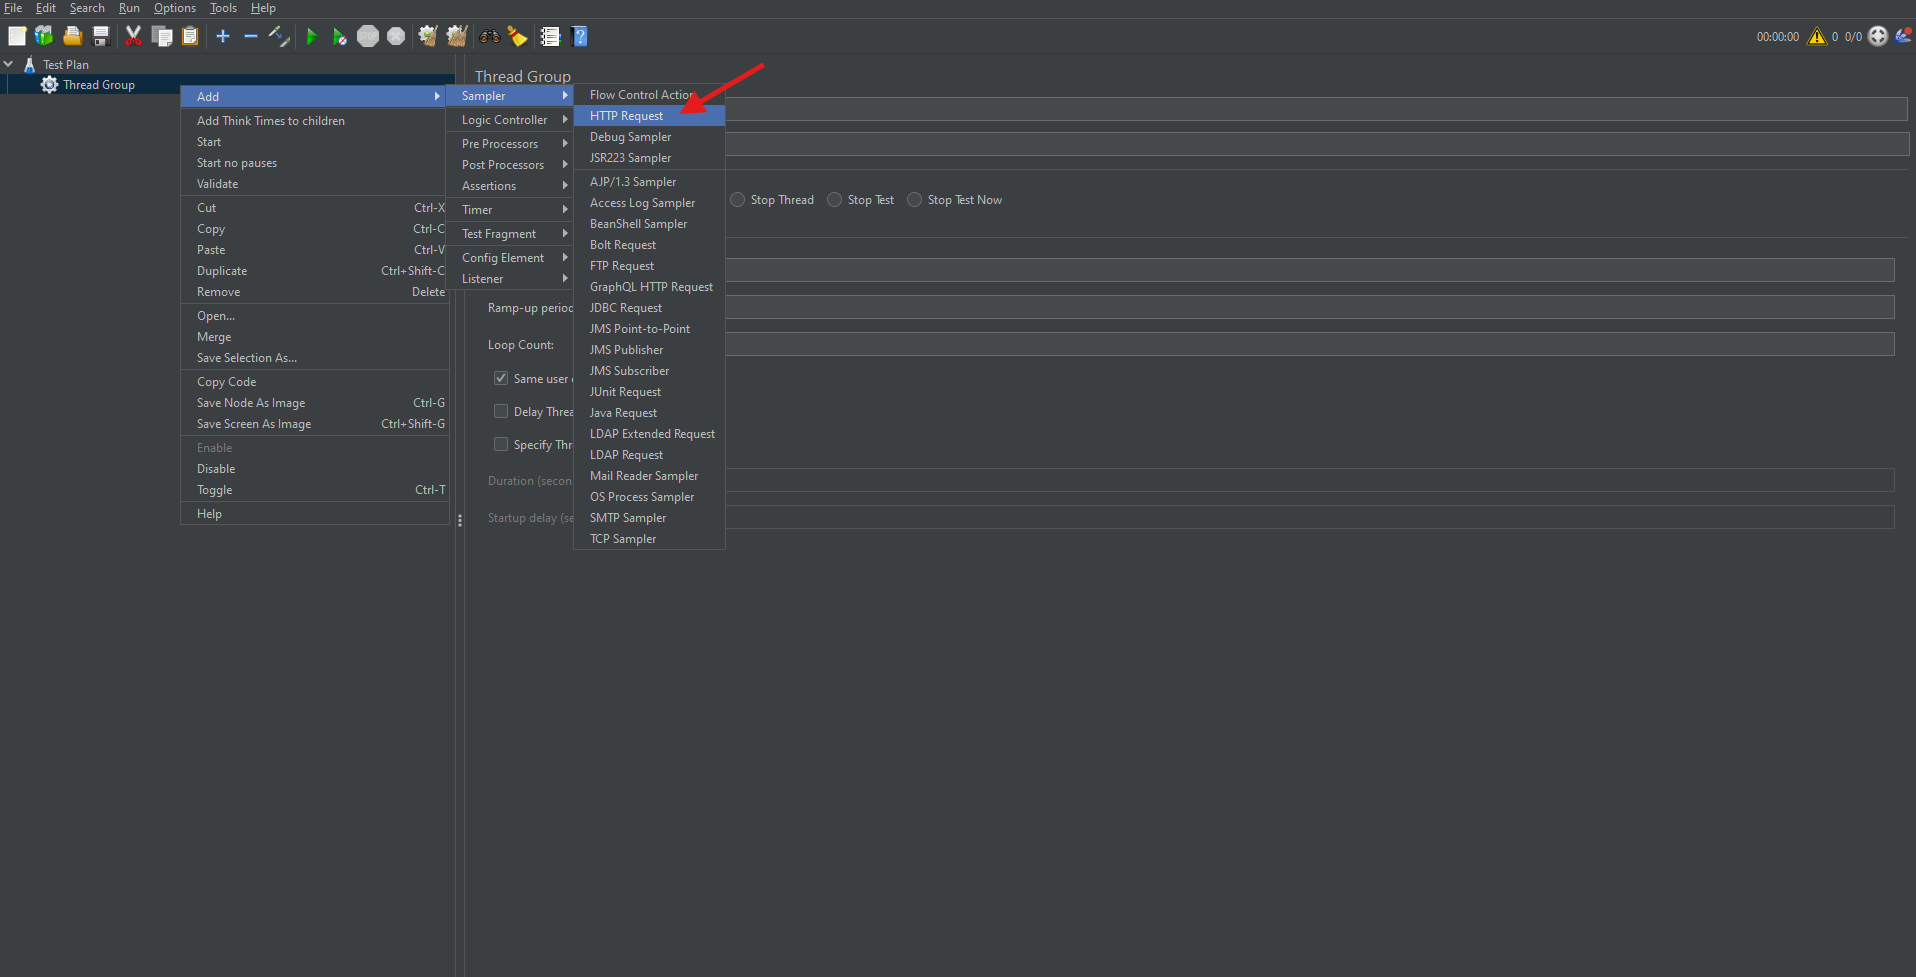
Configure the following parameters:
- Protocol: Use “http” or “https”.
- Server Name or IP: The domain or IP address of the server. (Ex: Testing.com)
- Path: The API endpoint or resource path. (api/users)
- Method: HTTP method like GET or POST.
This sampler allows you to test how your server or API handles web requests.
Running Sample HTTP Requests in JMeter (Using ReqRes.in)
To better illustrate, let’s use https://reqres.in, a free mock API.
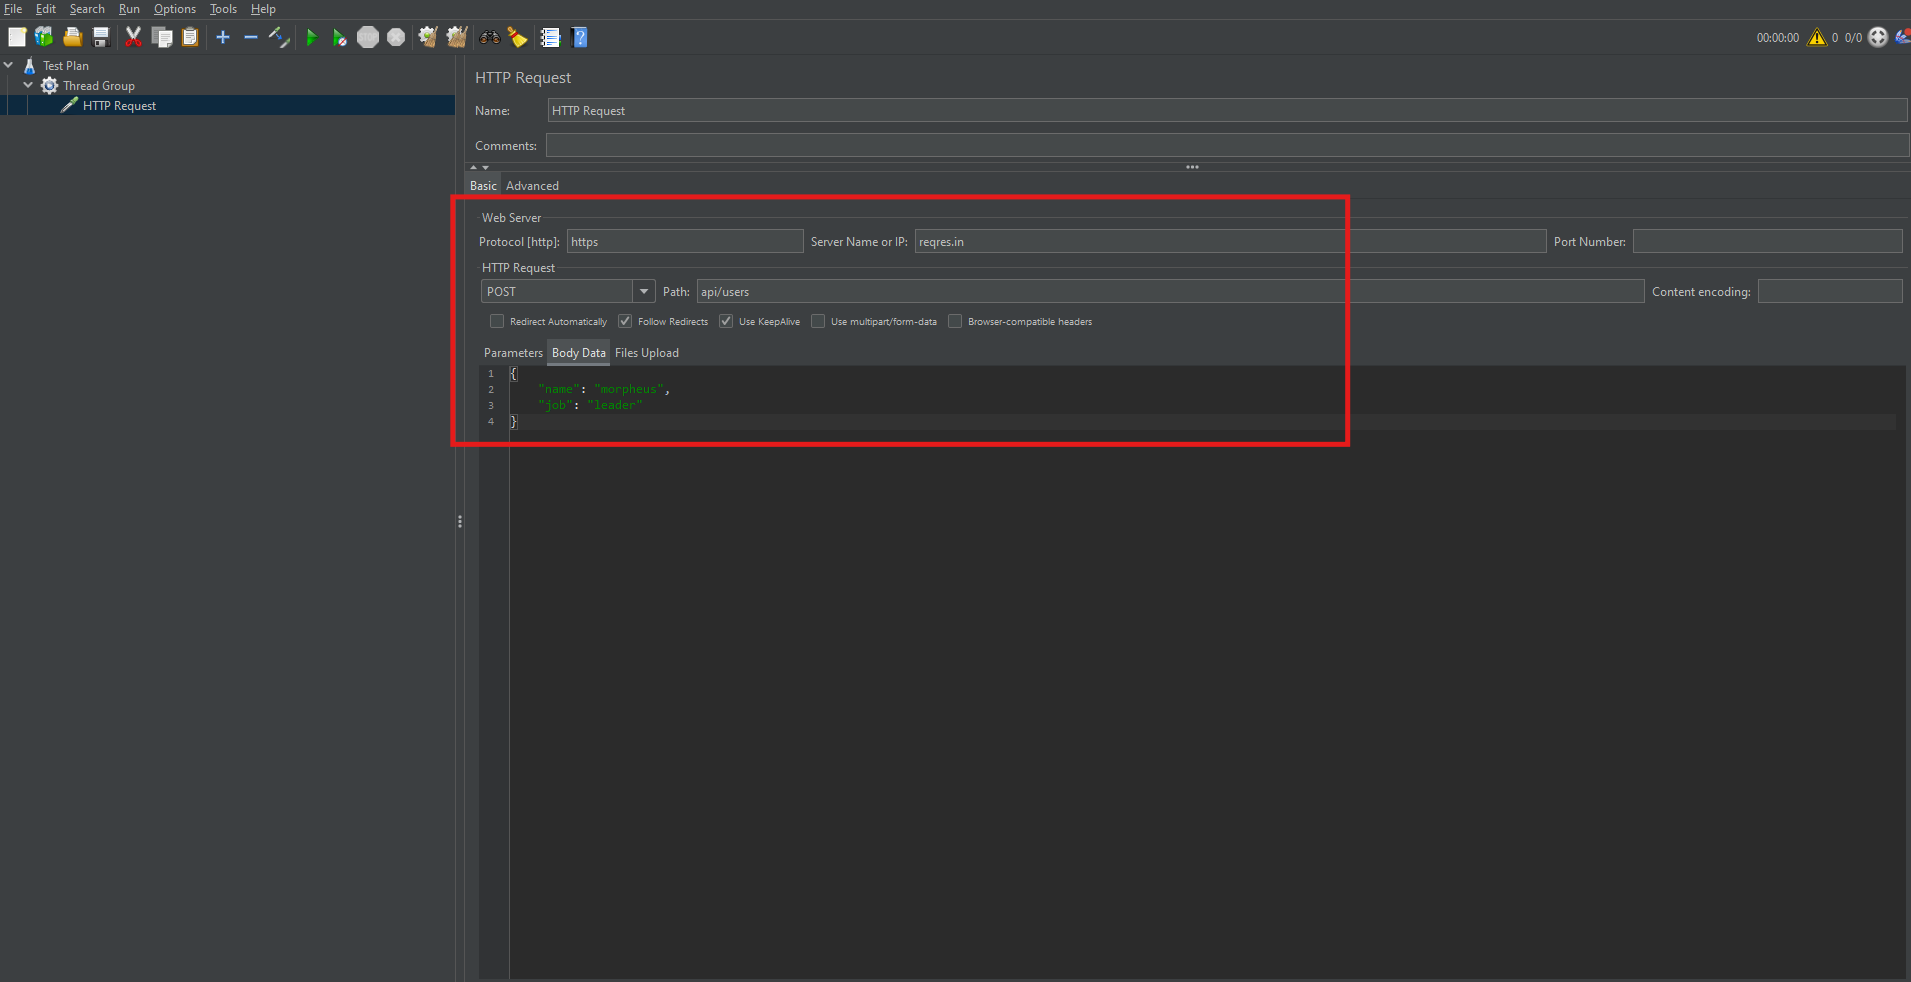
Example POST request settings:
- Protocol: https
- Server Name: reqres. in
- Method: POST
- Path: /api/users
In the Body Data tab, insert:
{
  "name": "morpheus",
  "job": "leader"
}
This setup helps simulate a user creation API request.
Adding Authorization with HTTP Header Manager
In many cases, you may need to send authenticated requests.
- Obtain your API key or token.
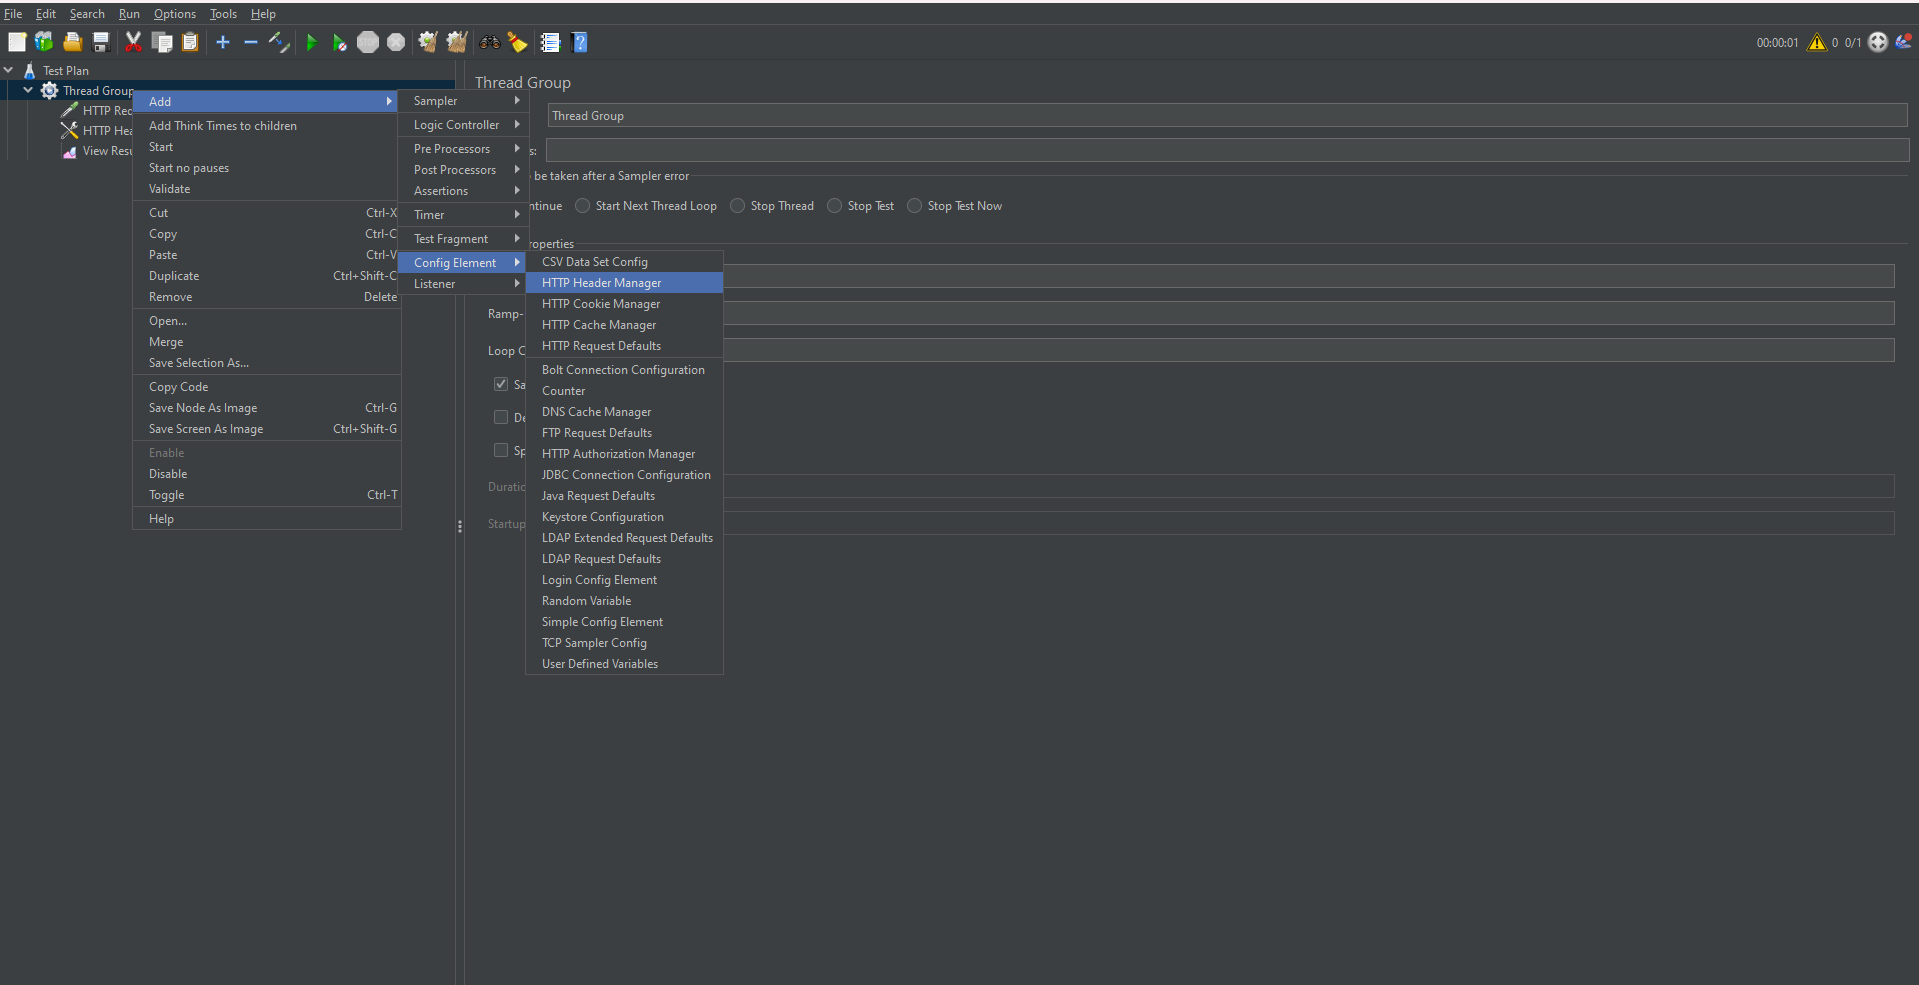
- Right-click on the HTTP Request Sampler.
- Choose Add → Config Element → HTTP Header Manager.
- Add the header:
- Name: x-api-key
- Value: your API token
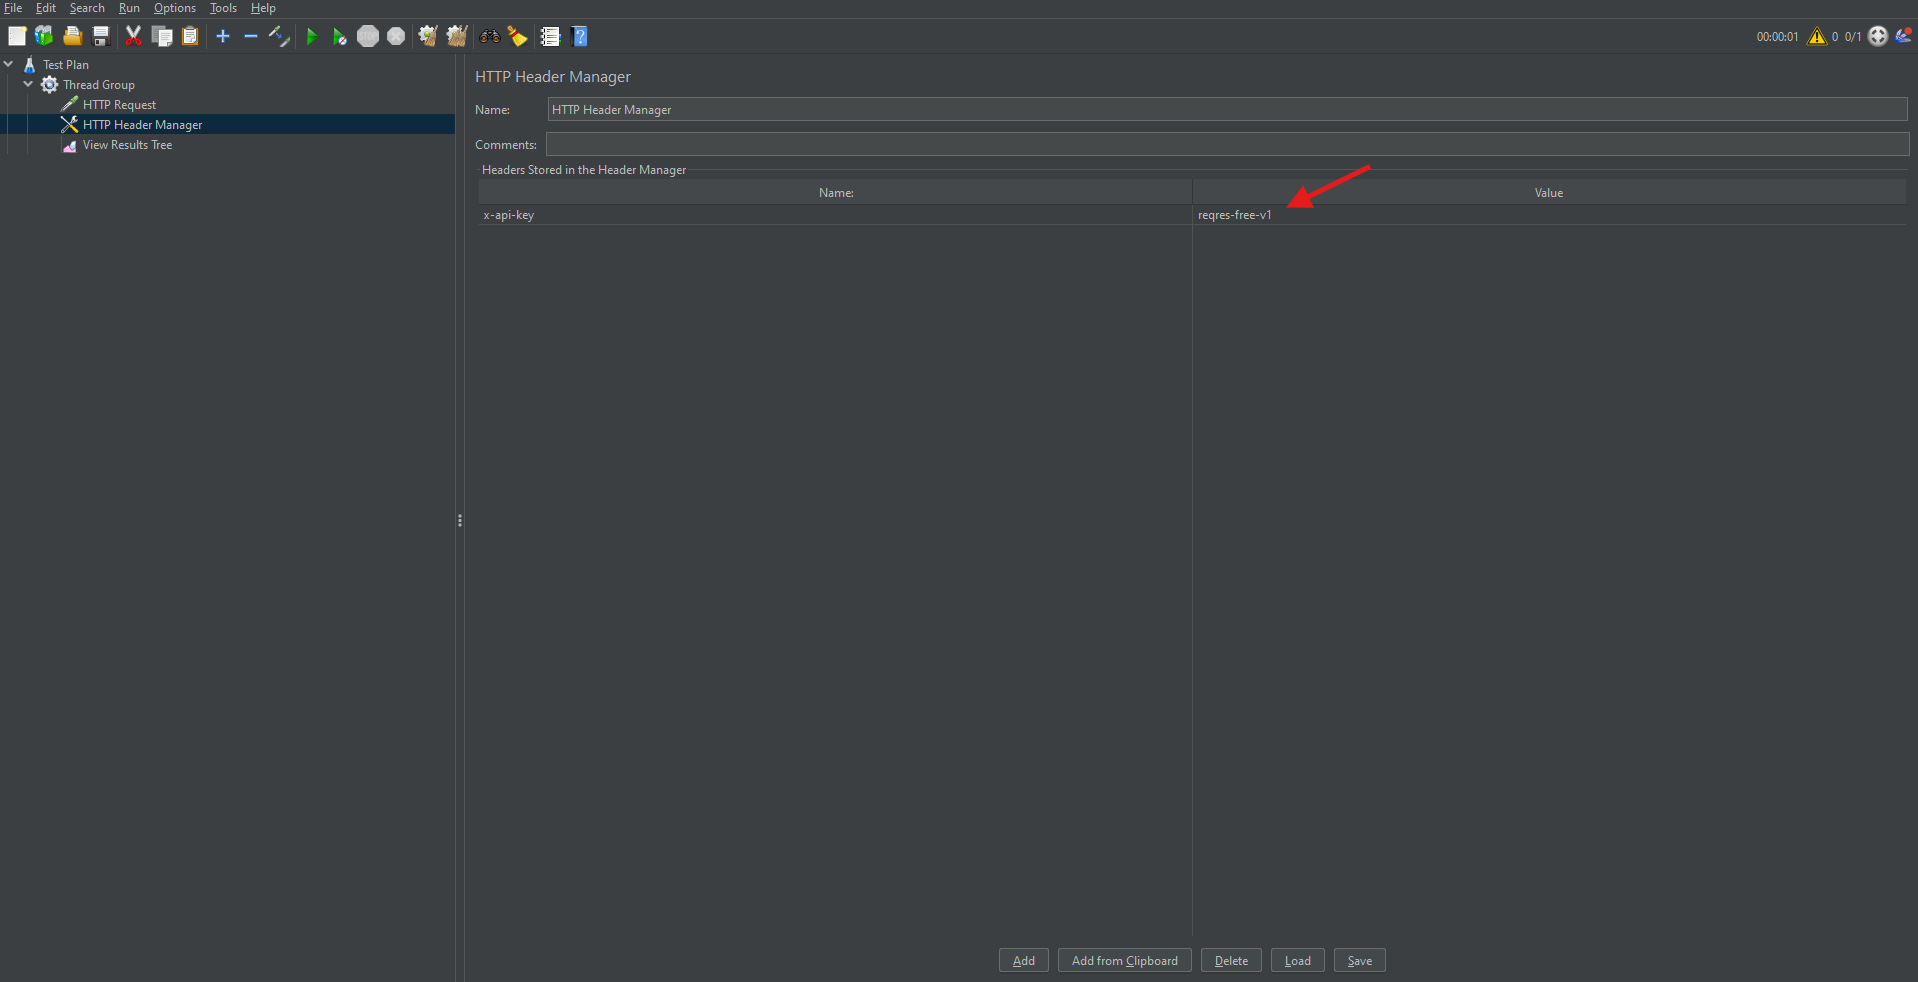
This allows JMeter to attach necessary authorization headers to requests.
Adding Listeners to Monitor and Analyze Results
Listeners are components that gather, display, and save the results of a performance test. They play a critical role in interpreting outcomes.
Common Listeners:
- View Results Tree: Displays request and response data.
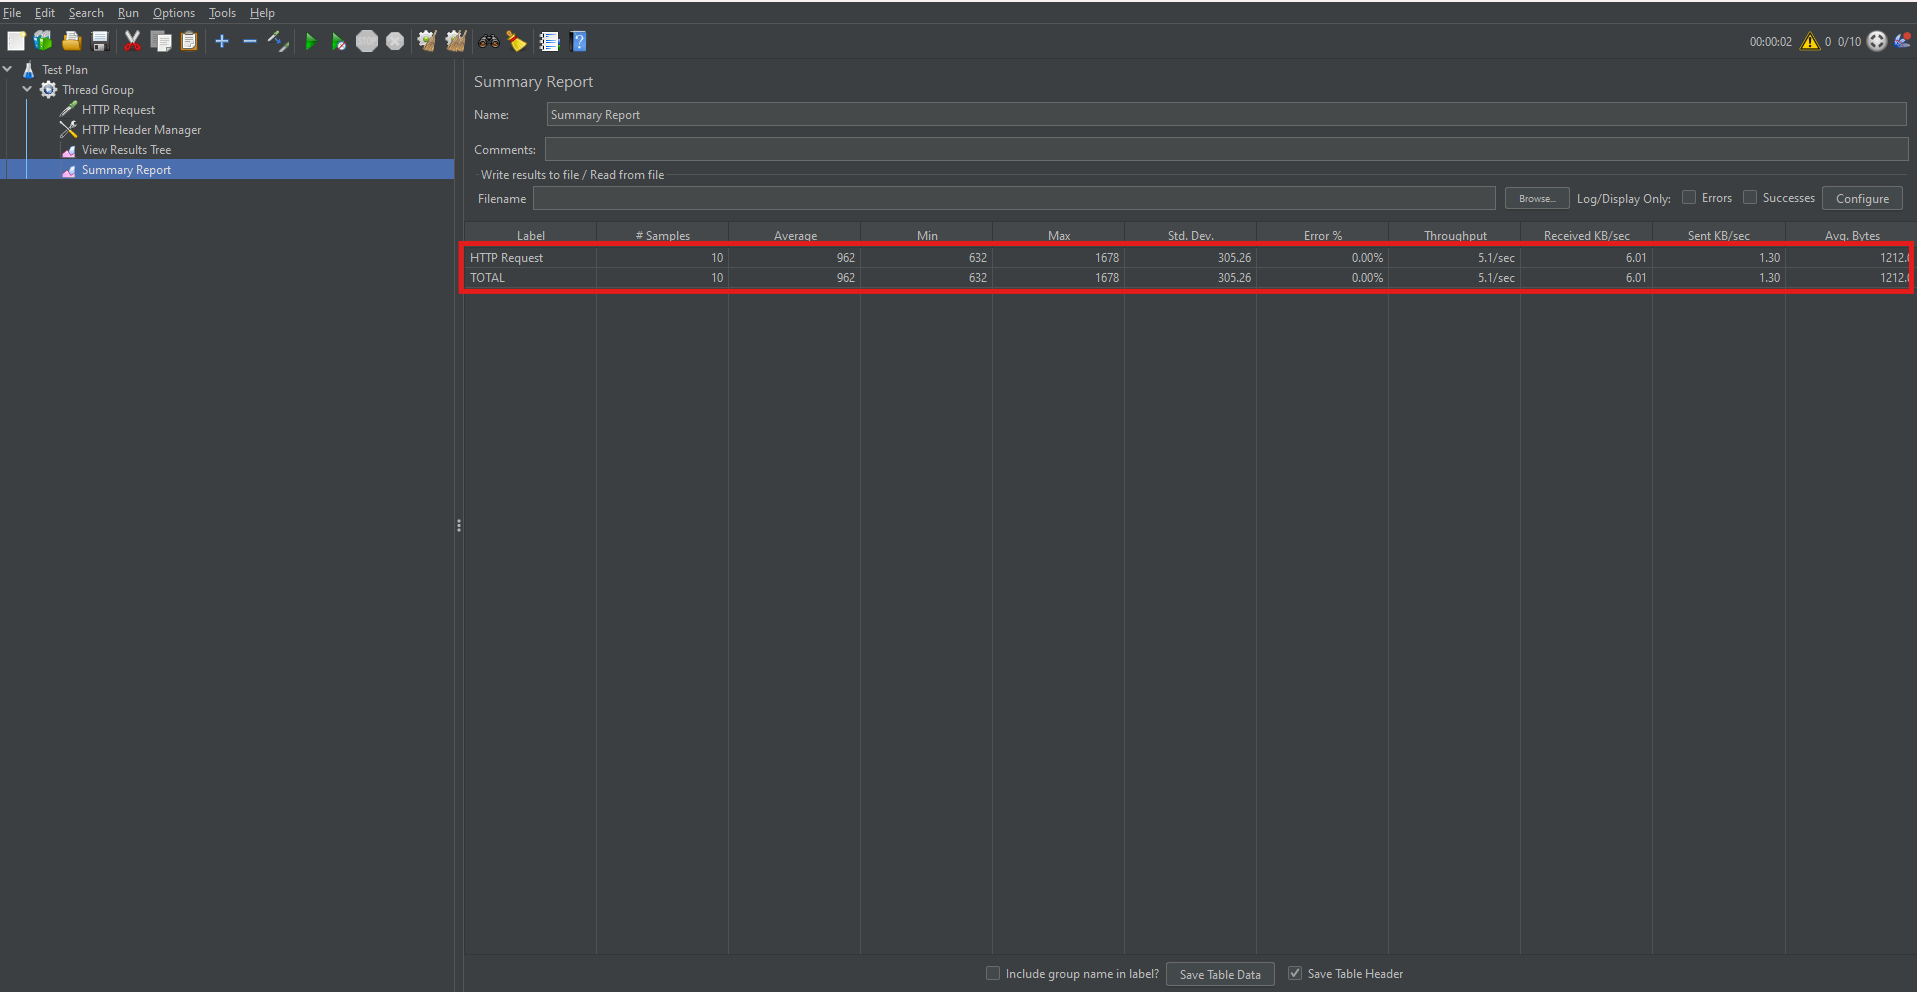
- Summary Report: Shows key metrics such as average response time, throughput, and error rate.
- Graph Results: Plots response times visually over time.
How to Add a Listener:
- Right-click on the Thread Group.
- Choose Add → Listener → Select the desired listener.
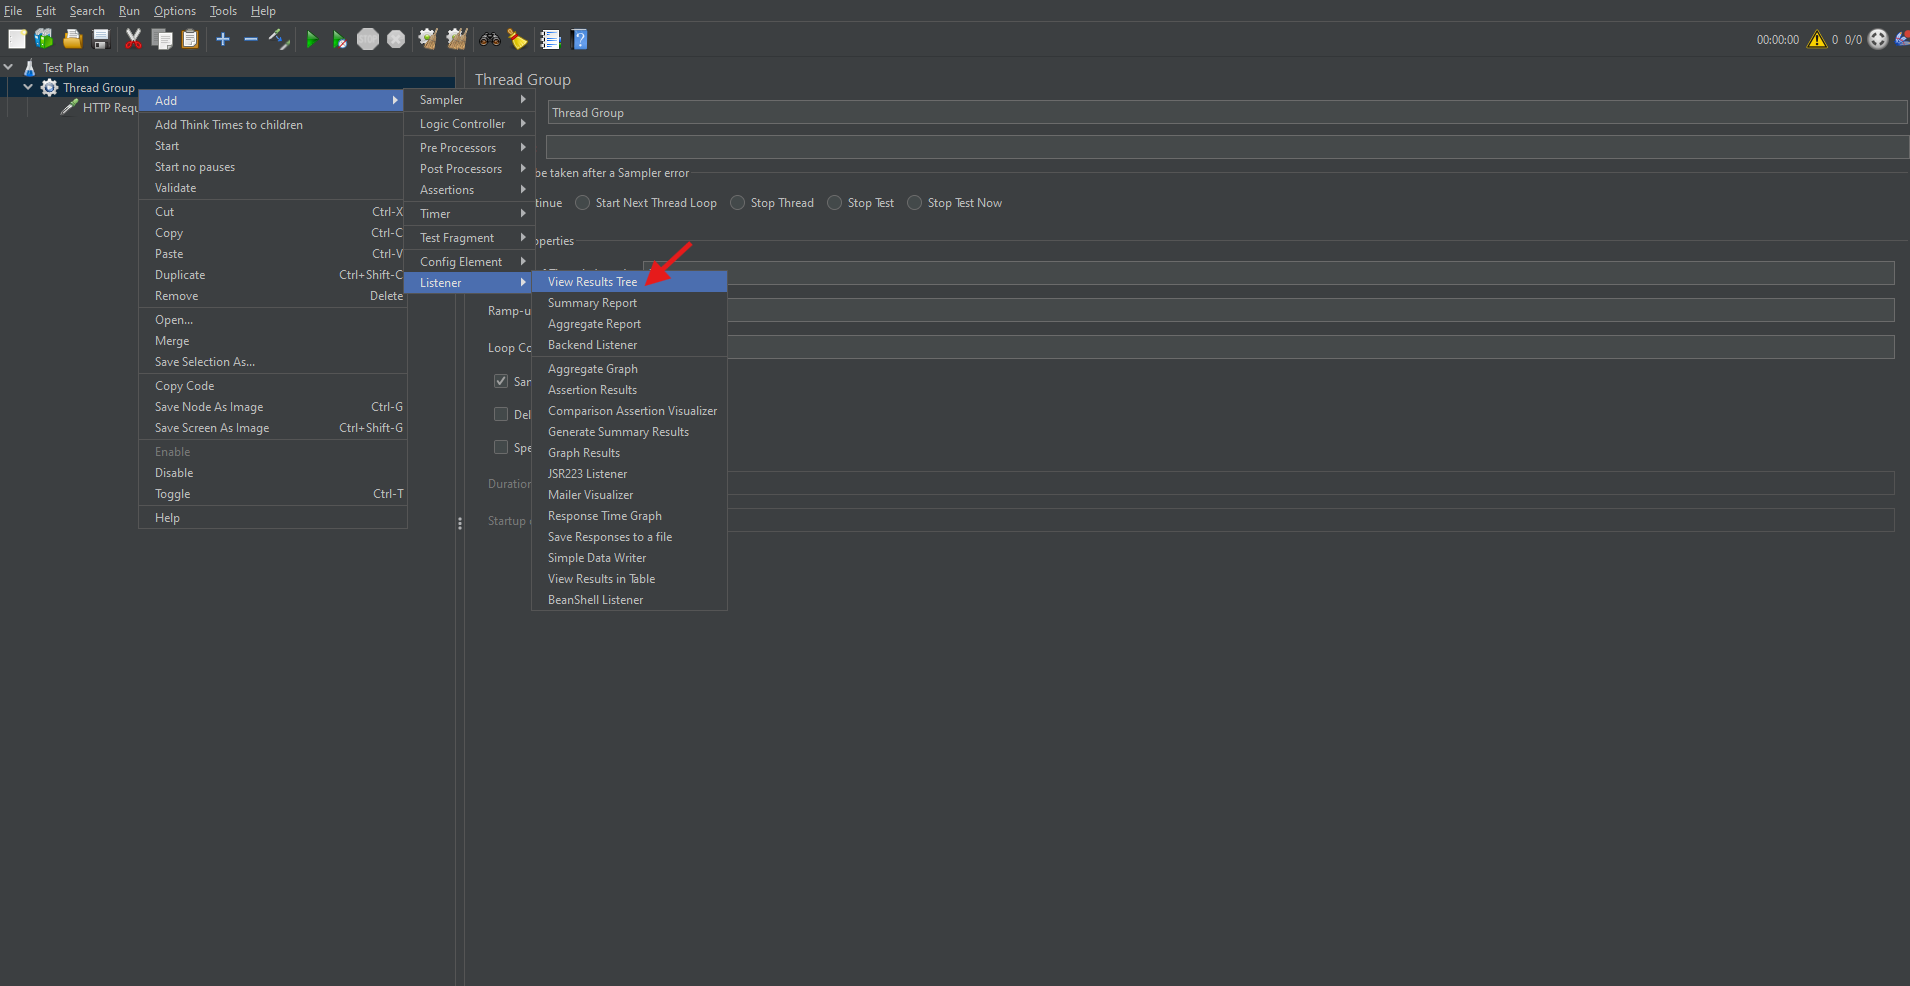
Listeners are essential for interpreting test performance.
Running the Test Plan
Once your Test Plan is configured, it’s time to execute it:
- Click the green Run button.
- Save the Test Plan when prompted.
- Observe real-time test execution in the selected Listeners.
- Stop the test using the Stop button (■) when done.
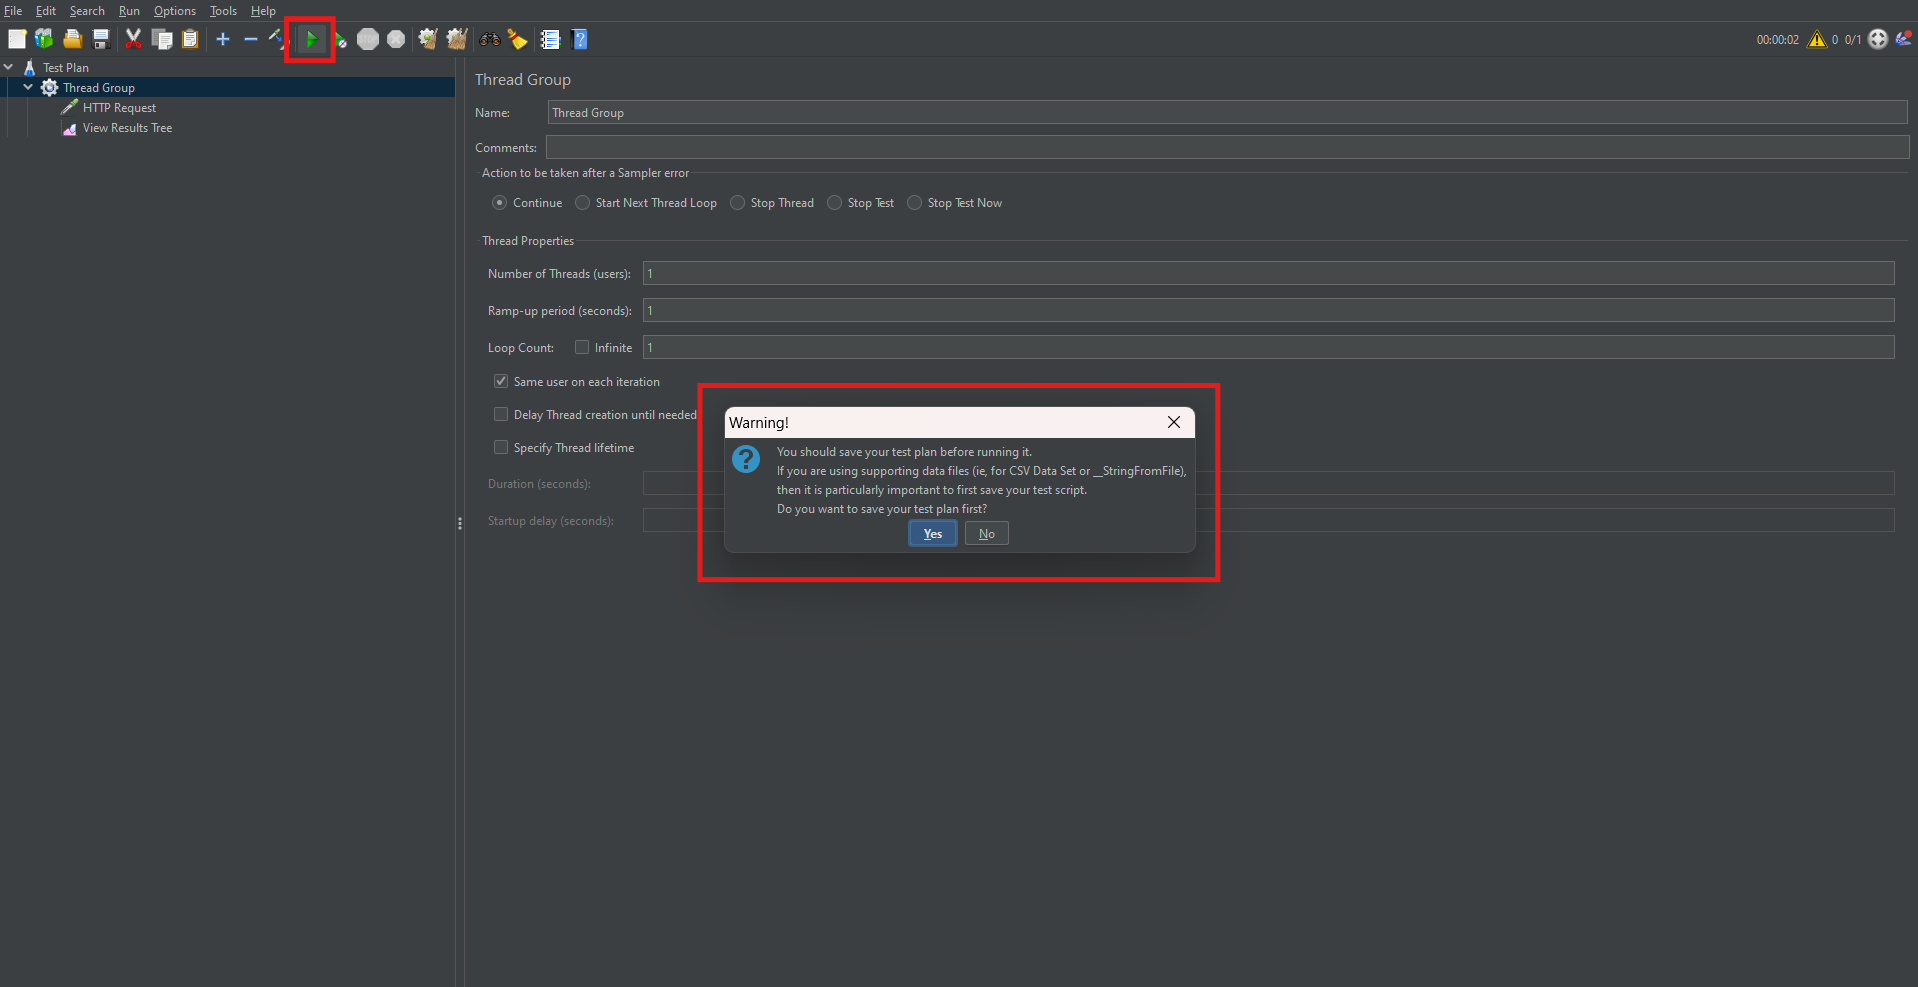
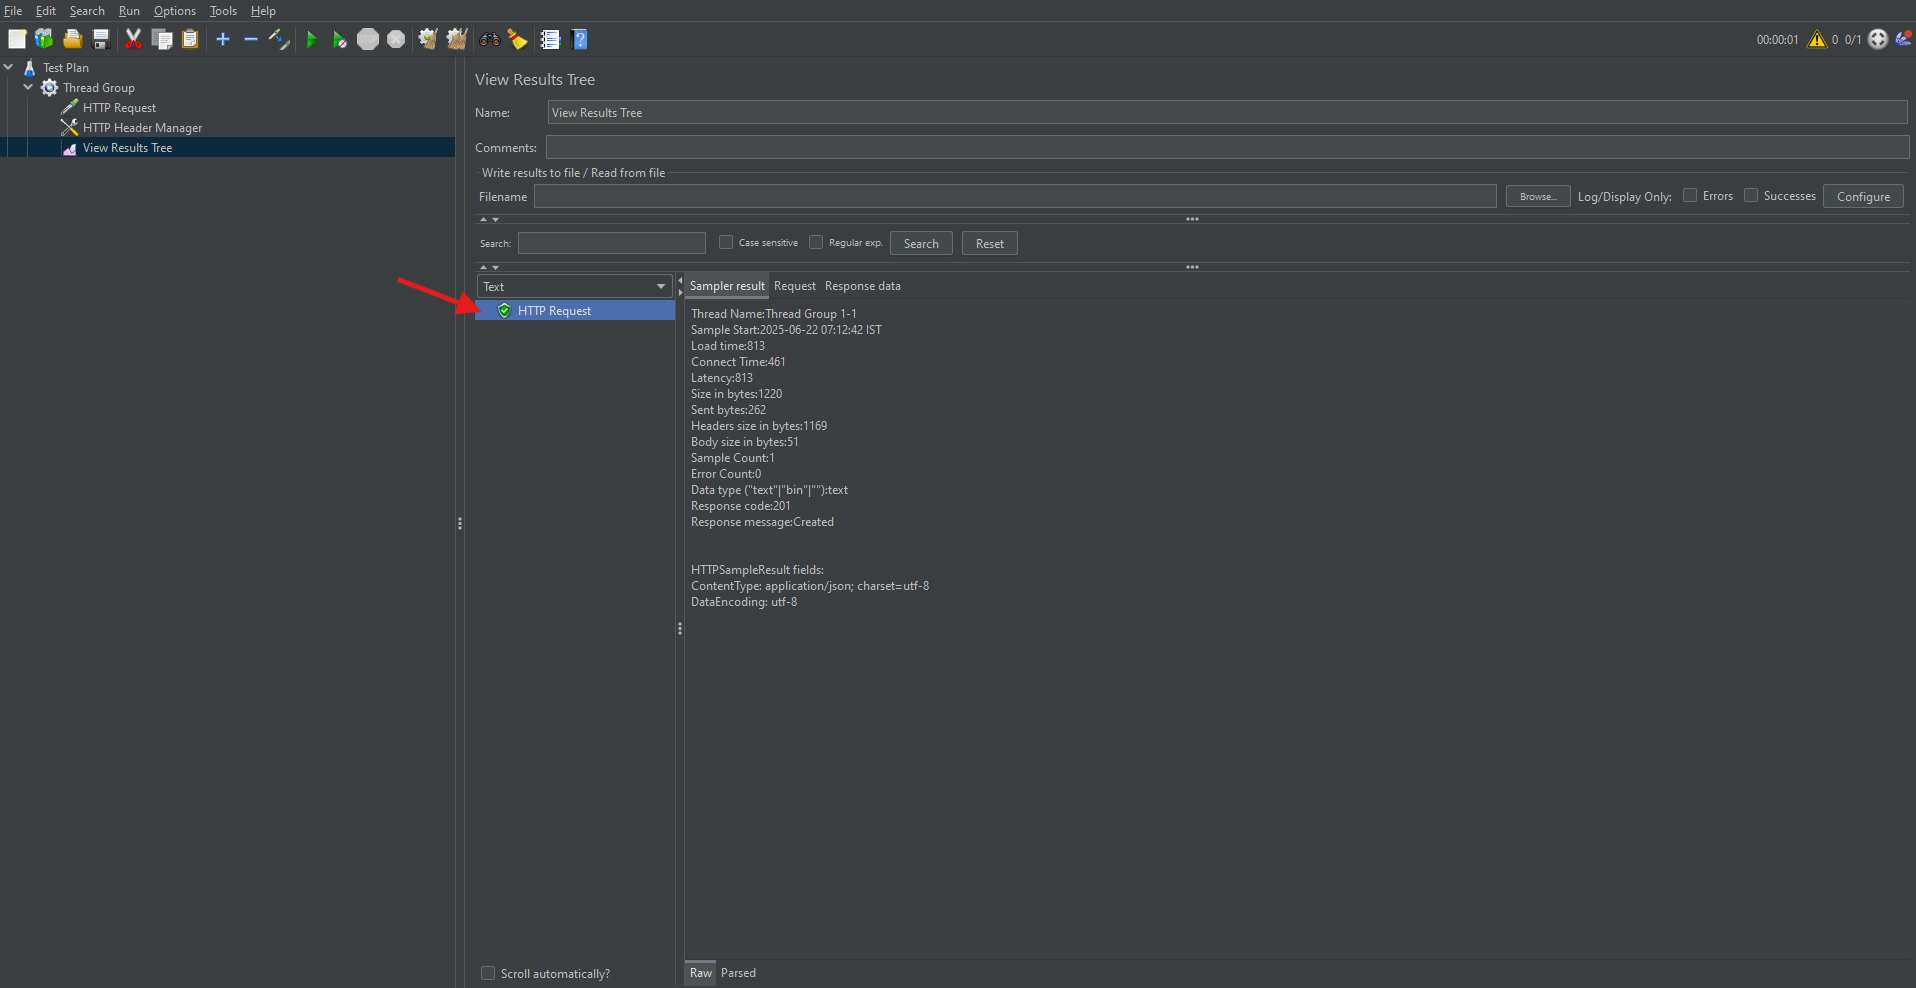
This execution simulates the defined user behavior and captures performance metrics.
Simulating Multiple Users
To thoroughly assess scalability, increase the load by adjusting the “Number of Threads (Users)” in the Thread Group.
For example:
- 10 users simulate 10 simultaneous requests.
- 100 users will increase the load proportionally.
This enables realistic stress testing of the system under high concurrency.
Related Blogs
JMeter on AWS: An Introduction to Scalable Load Testing
Performance Testing with K6: Run Your First Performance Test
Analyzing Test Results with Summary Report
The Summary Report provides crucial insights like average response time, throughput, and error percentages. Therefore, it’s essential to understand what each metric indicates.
Key Metrics:
- Average: Mean response time of all requests.
- Throughput: Number of requests handled per second.
- Error% : Percentage of failed requests.
Reviewing these metrics helps determine if performance criteria are met.
Generating an HTML Report in GUI Mode
To create a client-ready report, follow these steps:
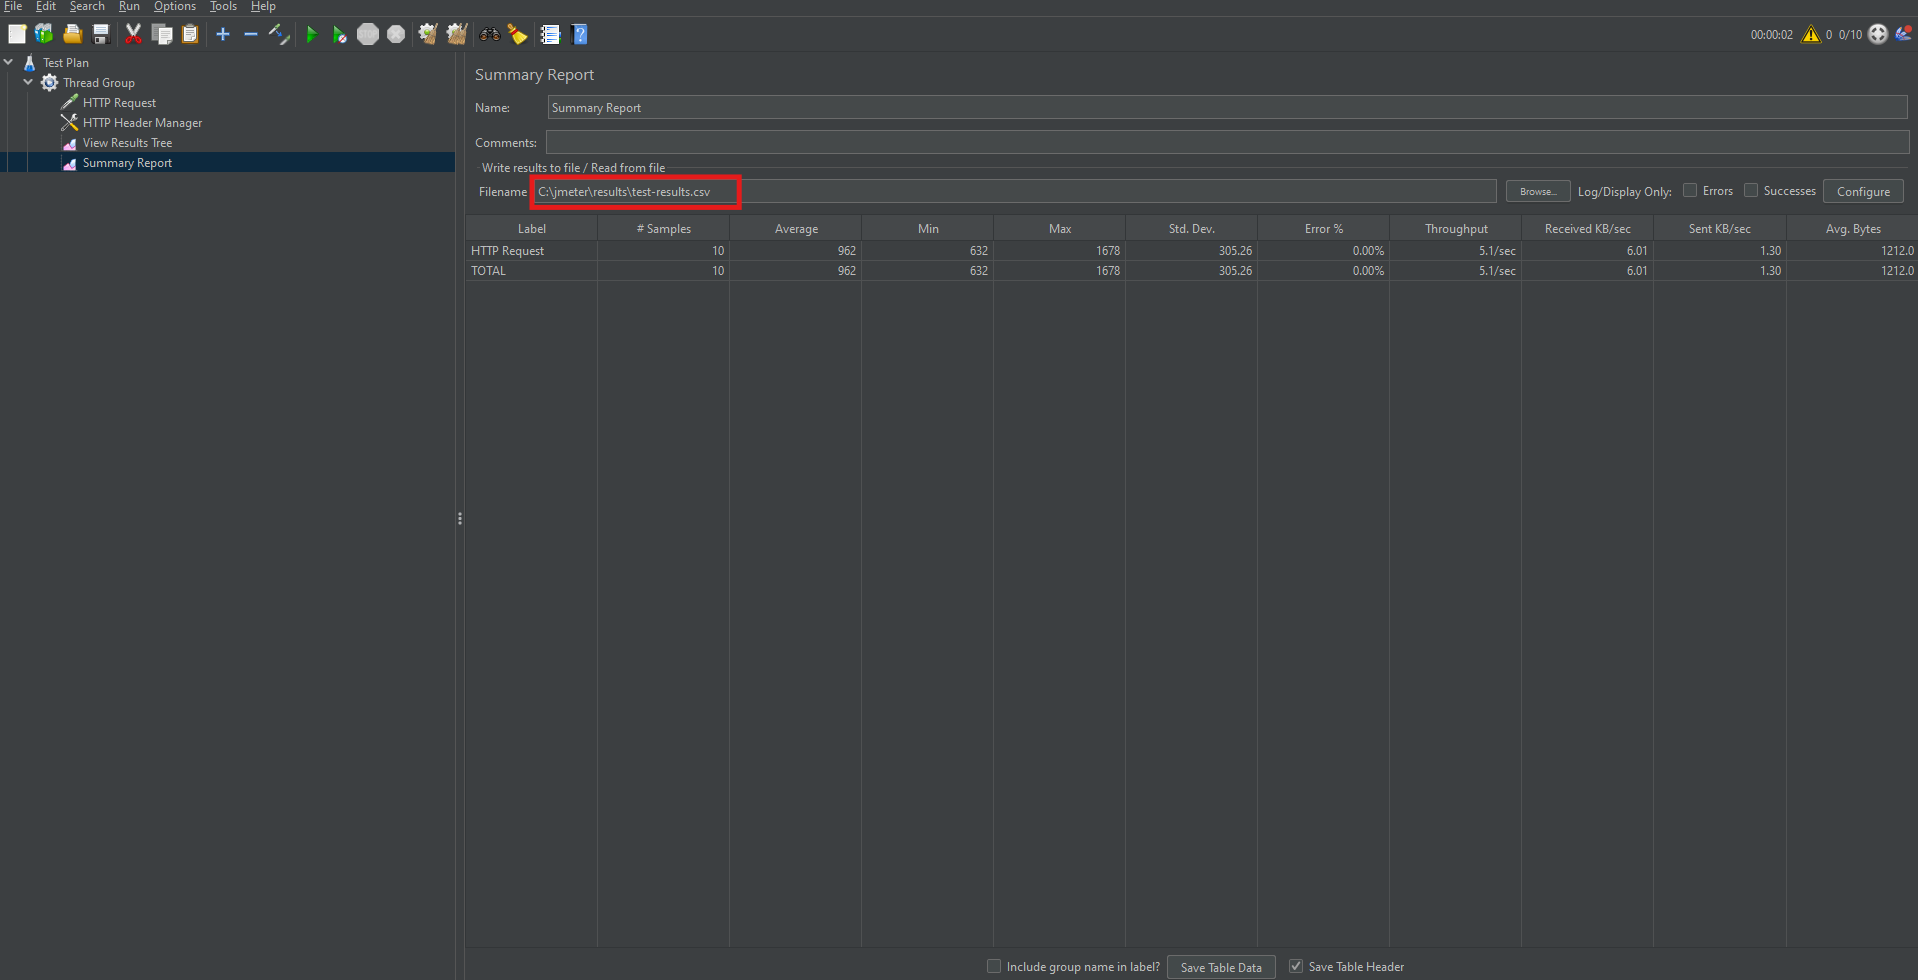
Step 1: Save Results to CSV
- In the Summary or Aggregate Report listener, specify a file name like results.csv.
Step 2: Create Output Directory
- For example, use path: D:JMeter_HTML_Report
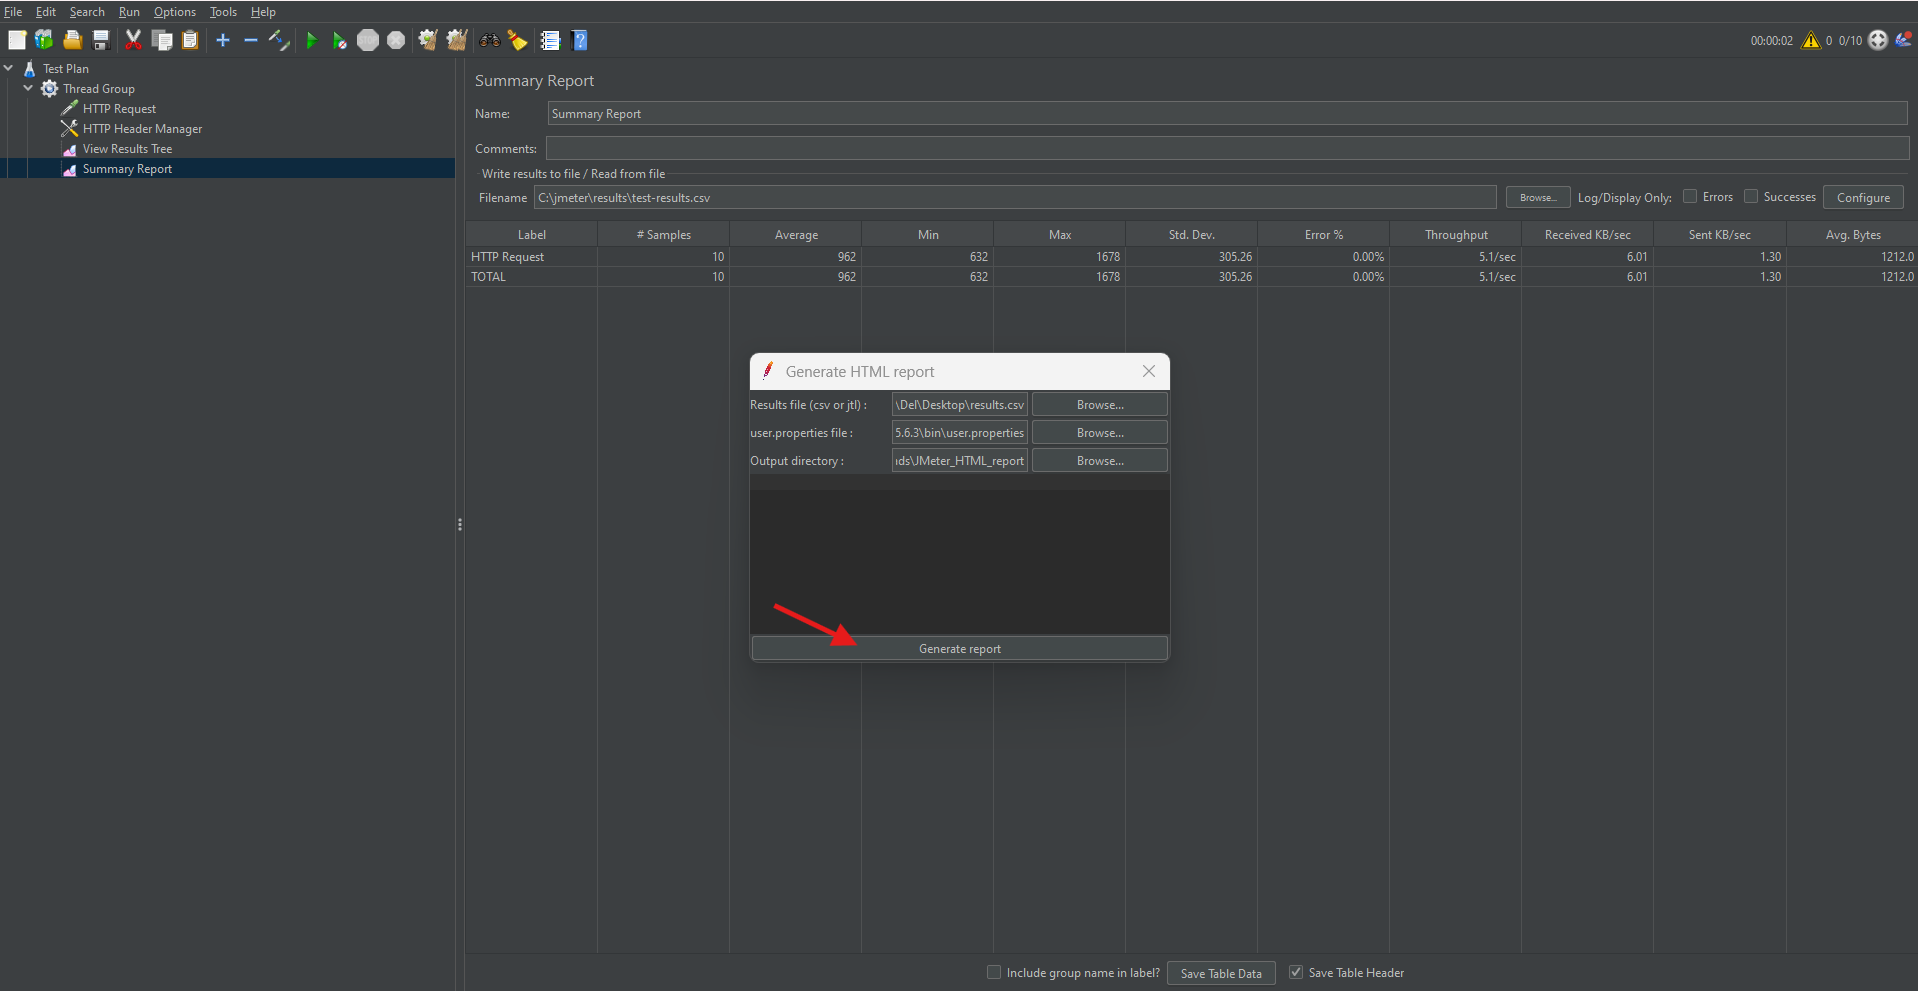
Step 3: Generate Report
- Go to Tools → Generate HTML Report.
- Results file path.
- user.properties file path.
- Output directory.
Step 2: Create Output Directory
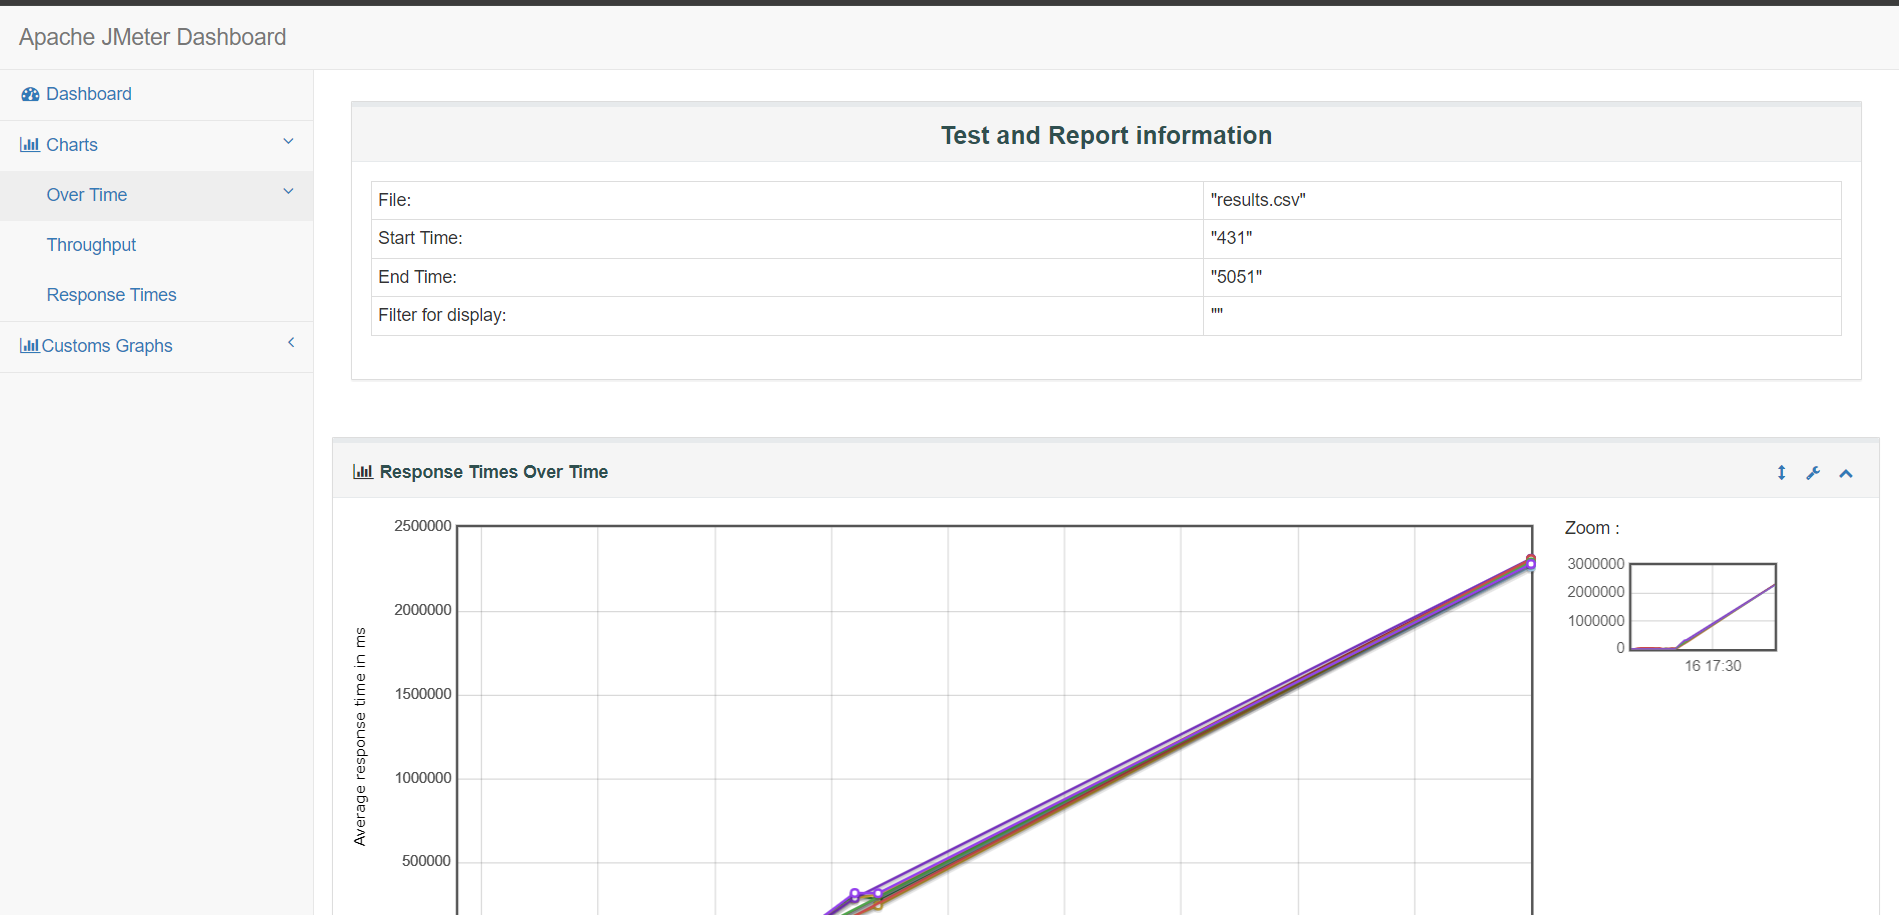
Step 4: View the Report
- Open index.html in the output folder using a web browser.
The HTML report includes graphical and tabular views of the test results, which makes it ideal for presentations and documentation.
Conclusion
In conclusion, Apache JMeter provides a flexible and powerful environment for performance testing of web applications and APIs. With its support for multiple protocols, ability to simulate high loads, and extensible architecture, JMeter is a go-to choice for QA professionals and developers alike.
This end-to-end JMeter tutorial walked you through:
- Installing and configuring JMeter.
- Creating test plans and adding HTTP requests.
- Simulating load and analyzing test results.
- Generating client-facing HTML reports.
By incorporating JMeter into your testing strategy, you ensure that your applications meet performance benchmarks, scale efficiently, and provide a smooth user experience under all conditions.
Frequently Asked Questions
-
Can JMeter test both web applications and APIs?
Yes, JMeter can test both web applications and REST/SOAP APIs. It supports HTTP, HTTPS, JDBC, FTP, JMS, and many other protocols, making it suitable for a wide range of testing scenarios.
-
Is JMeter suitable for beginners?
Absolutely. JMeter provides a graphical user interface (GUI) that allows beginners to create test plans without coding. However, advanced users can take advantage of scripting, CLI execution, and plugins for more control.
-
How many users can JMeter simulate?
JMeter can simulate thousands of users, depending on the system’s hardware and how efficiently the test is designed. For high-volume testing, it’s common to distribute the load across multiple machines using JMeter’s remote testing feature.
-
What is a Thread Group in JMeter?
A Thread Group defines the number of virtual users (threads), the ramp-up period (time to start those users), and the loop count (number of test iterations). It’s the core component for simulating user load.
-
Can I integrate JMeter with Jenkins or other CI tools?
Yes, JMeter supports non-GUI (command-line) execution, making it easy to integrate with Jenkins, GitHub Actions, or other CI/CD tools for automated performance testing in your deployment pipelines.
-
How do I pass dynamic data into JMeter requests?
You can use the CSV Data Set Config element to feed dynamic data like usernames, passwords, or product IDs into your test, enabling more realistic scenarios.
-
Can I test secured APIs with authentication tokens in JMeter?
Yes, you can use the HTTP Header Manager to add tokens or API keys to your request headers, enabling authentication with secured APIs.
The post JMeter Tutorial: An End-to-End Guide appeared first on Codoid.
Source: Read More


